Weather measurement
Loading
Uses actual Tempest measurement time
Live local conditions
Twinsburg, Ohio
--°F
Loading Twinsburg conditions…
Connecting to the latest Tempest and PurpleAir measurement windows.
Air-quality measurement
Loading
Uses actual PurpleAir measurement time
Tempest weather station
Weather, fully resolved.
Five-minute local means, totals, extrema, and derived conditions in imperial units, shown only for the current published window.
5-minute window
Hyperlocal NWS forecast blend
Hourly NWS grids near Burke Lakefront and Akron Fulton are blended numerically for Twinsburg[cite: 5].
Weighting: 54% KBKL-area grid + 46% KAKR-area grid
·
National Weather Service API
Daily outlook
Seven-day blended forecastLoading NWS daily forecast…
Hourly forecast
Next 36 hours · scroll horizontallyLoading hourly forecast…
Forecast temperature and precipitation
Blended hourly temperature with NWS probability of precipitation.
Chart.js is unavailable; the forecast cards remain usable.
Temperature
-- °F
Feels like --°F
Humidity
-- %
Dew point --°F
Pressure
-- inHg
Station pressure, five-minute mean
UV index
--
Five-minute mean
Wind field
Speed-weighted circular direction with five-minute lull, mean, and gust.
NESW
--mph mean
Direction--
Lull-- mph
Average-- mph
Gust-- mph
Rain rate
-- in/h
Five-minute total -- in
Solar radiation
-- BTU/h/ft²
Illuminance -- fc
Lightning
-- Strikes
Average distance 0.0 miles
Precipitation
--
Current sensor classification
Atmospheric science
Derived only from the local Tempest temperature, humidity, dew point, station pressure, wind, and solar measurements.
Wet-bulb temperature—Evaporative-cooling limit
Absolute humidity—Water vapor mass per air volume
Vapor pressure deficit—Atmospheric drying power
Moist-air density—Using station pressure
Mixing ratio—Water vapor per kg dry air
Pressure altitude—Standard-atmosphere equivalent
Density altitude—Pressure altitude adjusted for heat
Estimated cloud base—Temperature–dew-point spread
Five-minute wind run—Air distance past the station
Solar irradiance—Converted from BTU/h/ft²
Twinsburg 15-mile storm analysis
Local severe-weather outlook.
Regional NOAA outlooks are paired with a high-resolution analysis centered on Twinsburg. The local model evaluates the surrounding 15 miles plus the upstream storm corridor for instability, rotation, wind shear, hail growth, rainfall efficiency, Lake Erie boundaries, terrain, observed winds, and west-to-east temperature contrasts.
Loading severe-weather data
Active National Weather Service alerts
Official alert details for the Twinsburg point, checked every 30 seconds.
Twinsburg local severe signal
An hourly percentage-based neighborhood threat signal derived from NOAA high-resolution model ingredients, upstream flow, and current Tempest winds. Displayed threat values are capped at 95%.
NOAA HRRR·Open-Meteo model delivery·April 15, 2026 NWS case study·15-mile local ring + 90-mile upstream corridor
—%local signalAnalyzing the next 48 hours
Building the Twinsburg-specific outlook…
Waiting for high-resolution instability and wind-profile data.
Tornado—%Rotation + instability
Large hail—%Hail-growth environment
Damaging wind—%Downdraft + wind profile
Flash flooding—%Rainfall efficiency
Loading CAPE, CIN, SRH, EHI, wind shear, upstream support, temperature contrast, and moisture…
Loading the local severe-weather timeline…
Chart.js is unavailable; the local severe cards remain usable.
Official outlook context and local 15-mile timing are loading.
The local score weighs storm-supportive and storm-limiting factors together. It tracks organized severe-weather ingredients approaching from the west and southwest, compares current Tempest winds with the modeled low-level flow, allows strong long-track hail setups to persist into cooler air, and reduces surface-based wind or tornado signals when storms encounter a materially cooler or drier east-side environment.
Official regional outlook
NOAA probabilities provide the broader setup; the local panel above narrows the environment to Twinsburg and nearby communities.
Storm Prediction Center·Weather Prediction Center·Regional context; the Twinsburg 15-mile signal is shown above
Loading tornado, hail, wind, and flood outlooks…
PurpleAir Zen
Air quality, particle by particle.
PM2.5* and AQI* are paired with combined particle counts, Bosch VOC, visibility estimates, and aerosol-size science.
Current local window
Air-quality forecast
Regional and atmospheric guidance localized to current air conditions in Twinsburg.
Loading the available EPA, AQICN, or atmospheric-model outlook for Twinsburg.
Daily air-quality outlook
Regional source and localized Twinsburg AQILoading air-quality forecast…
Hourly particulate outlook
Model guidance localized to the latest monitor readingLoading hourly air forecast…
Chart.js is unavailable; the air forecast cards remain usable.
Regional forecast guidance is adapted to the latest Twinsburg monitor conditions. Source values remain available for comparison.
AQI position
One continuous AQI scale is used for all displayed values, including hazardous readings above 500.
AQI*----
Good0–50
Moderate51–100
USG101–150
Unhealthy151–200
Very unhealthy201–300
Hazardous301+
PM1.0
-- µg/m³
Five-minute sensor-combined CF=1 estimate
PM2.5*
-- µg/m³
Current five-minute concentration
PM10
-- µg/m³
Five-minute sensor-combined CF=1 estimate
Visibility estimate
-- mi
PM2.5 haze estimate
Bosch VOC
-- IAQ RU
Bosch Static IAQ relative units
Particles ≥0.3 µm
-- /dL
Five-minute combined particle count
Particle number distribution
Non-overlapping particle-size bands derived from the cumulative PurpleAir counts. Bar colors move through the AQI palette as the estimated size-band burden increases.
lowermoderateelevatedhighvery highextreme
Charts require Chart.js from the CDN.
Aerosol science snapshot
Public-facing calculations use PM2.5* whenever available and combined sensor values for measurements without an adjusted field.
Estimated coarse PM—PM10 minus PM2.5*, floored at zero
Fine-count share—Particles below 2.5 µm by count proxy
Particles ≥0.5 µm—Combined count per deciliter
Particles ≥1.0 µm—Combined count per deciliter
Particles ≥2.5 µm—Combined count per deciliter
Particles ≥10 µm—Combined count per deciliter
Pollen, mold, mites, dander, and airborne irritants
Allergen outlook.
Free public pollen reports are combined with local weather and air measurements to estimate the allergens most likely to affect conditions around Twinsburg.
Updated Jul 18, 2026, 2:07 PM EDT
Twinsburg allergen forecast
Tree, grass, ragweed and other weed pollen, mold spores, dust mites, pet dander, airborne dust, and fine-particle irritation.
Free public allergen sources·Free public allergen reports · pollen and mold outlook active
Main upcoming allergenRagweed pollen
Highest available index 2/5 · Moderate. Leading reported types include grasses, nettle, plantain, dock/sorrel, ragweed, Cladosporium, and Alternaria.
Ragweed pollenModerateIndex 2/5 · 18 grains/m³
Other weed pollenModerateIndex 2/5 · 18 grains/m³
Grass pollenLowIndex 1/5 · 1 grain/m³
Mold sporesLowIndex 1/5 · 3,020 spores/m³
Tree pollenNoneIndex 0/5 · 0 grains/m³
Dust-mite conditionsUpdatingCalculated from local warmth and moisture
Pet-dander persistenceUpdatingCalculated from ventilation and particle conditions
Airborne dustUpdatingCalculated from coarse particles, dryness, and wind
Fine-particle irritationUpdatingCalculated from the current local PM2.5 and AQI
- Tree pollen0/5 · None
- Grass pollen1/5 · Low
- Ragweed pollen2/5 · Moderate
- Other weed pollen2/5 · Moderate
- Mold spores1/5 · Low
Pollen and regional mold information come from low-frequency public allergen reports. Local weather then adjusts transport and persistence around Twinsburg. Dust-mite, pet-dander, airborne-dust, and fine-particle scores use the current Tempest and PurpleAir environment.
Astronomy and space weather
The sky above Twinsburg.
Local solar and lunar geometry combines with NOAA space-weather forecasts and the blended NWS sky forecast.
Calculated locally
Sun and moon
Calculated for Twinsburg coordinates in Eastern Time using SunCalc.
Sunrise—Civil dawn —
Sunset—Civil dusk —
Day length—Solar noon —
Moonrise—Moonset —
Calculating upcoming daylight…
Moon phase— illuminated
Northern lights visibility for the average observer
NOAA SWPC activity is filtered through local darkness, cloud cover, visibility, precipitation, and moonlight.
—viewing score
Calculating visibility…
Waiting for space-weather and local sky forecasts.
Best time—
Peak Kp—
Cloud cover—
Visibility—
Vividness—
OVATION near site—
Solar wind—
Geomagnetic level—
Loading viewing windows…
Chart.js is unavailable; the viewing timeline remains usable.
The viewing score combines NOAA activity with local darkness, cloud cover, visibility, precipitation, and moonlight. In Twinsburg, activity below roughly Kp 6 is generally camera-only; Kp 7–9 can become visible to the unaided eye when the northern sky is dark and clear.
Regional geospatial intelligence
Earth observatory for Northeast Ohio.
A touchscreen map combines OpenStreetMap, USGS topography and hydrography, NASA satellite imagery, current drought polygons, USGS stream gauges, recent earthquakes, and the Twinsburg 15-mile analysis ring.
Map layers initialize on selection
Regional environmental map
Switch between street, topographic, imagery, satellite, hydrography, drought, gauge, and earthquake layers.
USGS 3DEP elevationLoadingPoint elevation at Twinsburg
Current drought classLoadingU.S. Drought Monitor
Nearby USGS gaugesLoadingCurrent stage and discharge feeds
Regional earthquakesLoadingPast seven days
Current alert polygons—NWS alerts already loaded by this page
Hydrology, drought, and geology
Water and ground intelligence.
Near-real-time USGS streamflow and stage observations are paired with weekly drought intensity, 3DEP terrain elevation, and recent seismic activity around Northeast Ohio.
Loading public geoscience feeds
Local ground and water status
Current machine-readable observations and weekly environmental classifications.
Drought intensityLoadingCurrent weekly map
Nearest stream gaugeLoadingSearching nearby stations
Current discharge—Cubic feet per second
Current gauge height—Feet
Twinsburg ground elevationLoadingUSGS 3DEP point estimate
Nearby stream gauges
Closest active USGS stations with usable stage or discharge data.
Loading USGS water observations…
Recent seismic activity
Strongest and nearest earthquakes within 500 miles during the past seven days.
Loading USGS earthquake feed…
Airport observations and upstream boundaries
Aviation weather around Twinsburg.
METAR observations from Cleveland and Akron-area airports reveal wind shifts, ceilings, visibility gradients, pressure tendencies, and west-to-east temperature contrasts that can strengthen or weaken storms approaching Twinsburg.
Awaiting same-origin aviation update
Regional airport observations
KBKL, KCLE, KCGF, KAKR, and KCAK observations from NOAA Aviation Weather Center.
Awaiting the same-origin environmental update…
Upstream atmospheric diagnosis
Plain-language interpretation of airport temperature, dew point, wind, pressure, ceiling, and visibility differences.
West-to-east temperature—Awaiting airport observations
Wind-field agreement—Compared with the Tempest wind
Regional visibility—Airport minimum visibility
Lowest ceiling—Cloud-base constraint
Pressure spread—Mesoscale pressure contrast
Airport observations are obtained server-side and retained in the same-origin environmental-intelligence.json snapshot.
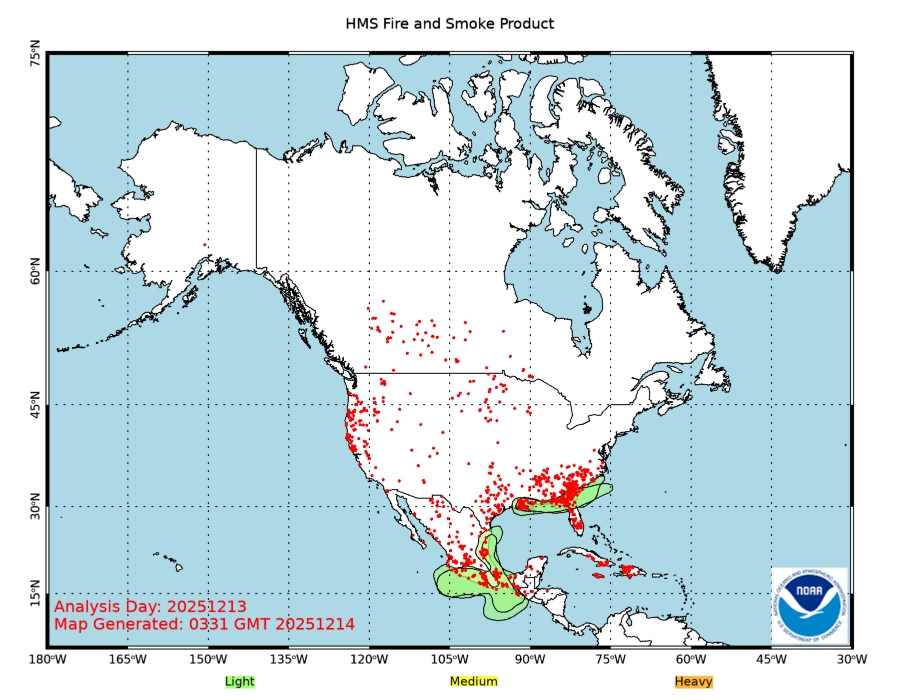
Satellite fire and smoke intelligence
Smoke corridors and active-fire context.
NOAA Hazard Mapping System imagery provides continental fire and smoke analysis while local Tempest winds and PurpleAir particles describe whether a transport corridor is aligned with Twinsburg.
NOAA HMS current analysis
NOAA Hazard Mapping System
Satellite-analyzed fire locations and smoke areas across North America.
Transport corridorCalculatingBased on current local wind direction
Local smoke burdenCalculatingPurpleAir PM2.5 and AQI
Outdoor visibilityCalculatingEstimated from PM2.5 and humidity
VentilationCalculatingWind-driven local dispersion
NOAA HMSNASA WorldviewCanadian Wildland Fire Information SystemUse the Regional Observatory menu view for satellite and topographic overlays.
OHGO road network
Awaiting OHGO
Road and traffic intelligence
Nearby incidents, closures, slowdowns, camera snapshots, and ODOT road-weather observations within 35 miles of Twinsburg.
Northeast Ohio travel map
Incidents, delays, cameras, road-weather stations, construction, and the Twinsburg 15-mile research radius.
Twinsburg road lensLoading OHGO road conditions.
Nearest active disruptions
Awaiting OHGO traffic data…
Live camera corridor
The nearest available ODOT camera snapshots, refreshed with the five-minute road-intelligence package.
Awaiting nearby traffic cameras…
Road-weather stations
Pavement temperature, surface state, visibility, precipitation, and wind from nearby ODOT RWIS sites.
Awaiting OHGO road-weather observations…
NOAA historical context
Awaiting NOAA CDO
Climate memory
Recent quality-controlled daily observations compared with nearby NOAA climate normals for the current time of year.
Recent temperature and seasonal baseline
Daily maximum and minimum temperatures with the available NOAA normal for today.
Climate chart will appear when NOAA data loads.
Resolving nearby station…—NOAA station metadata and observation dates will appear here.
Recent daily climate cards
Temperature, precipitation, snowfall, and wind from the latest available quality-controlled days.
Awaiting NOAA daily summaries…
NOAA radar laboratory
Preparing radar
Live radar laboratory
Quality-controlled MRMS base reflectivity around Twinsburg, refreshed every five minutes, with the latest KCLE Level-II research-volume metadata from NOAA Open Data.
MRMS base reflectivity
Pan, zoom, and compare the latest quality-controlled radar mosaic with the 15-mile Twinsburg analysis radius.
Latest mosaic
MRMS radar mosaicLoading the latest five-minute radar layer.
LightModerateHeavyVery heavySevereExtreme
Awaiting KCLE Level-II listing—NOAA NODD publishes raw research volumes as soon as they are available.
Radar echoes show targets aloft and do not guarantee precipitation is reaching the ground. Use local instruments and official NWS products alongside the map.